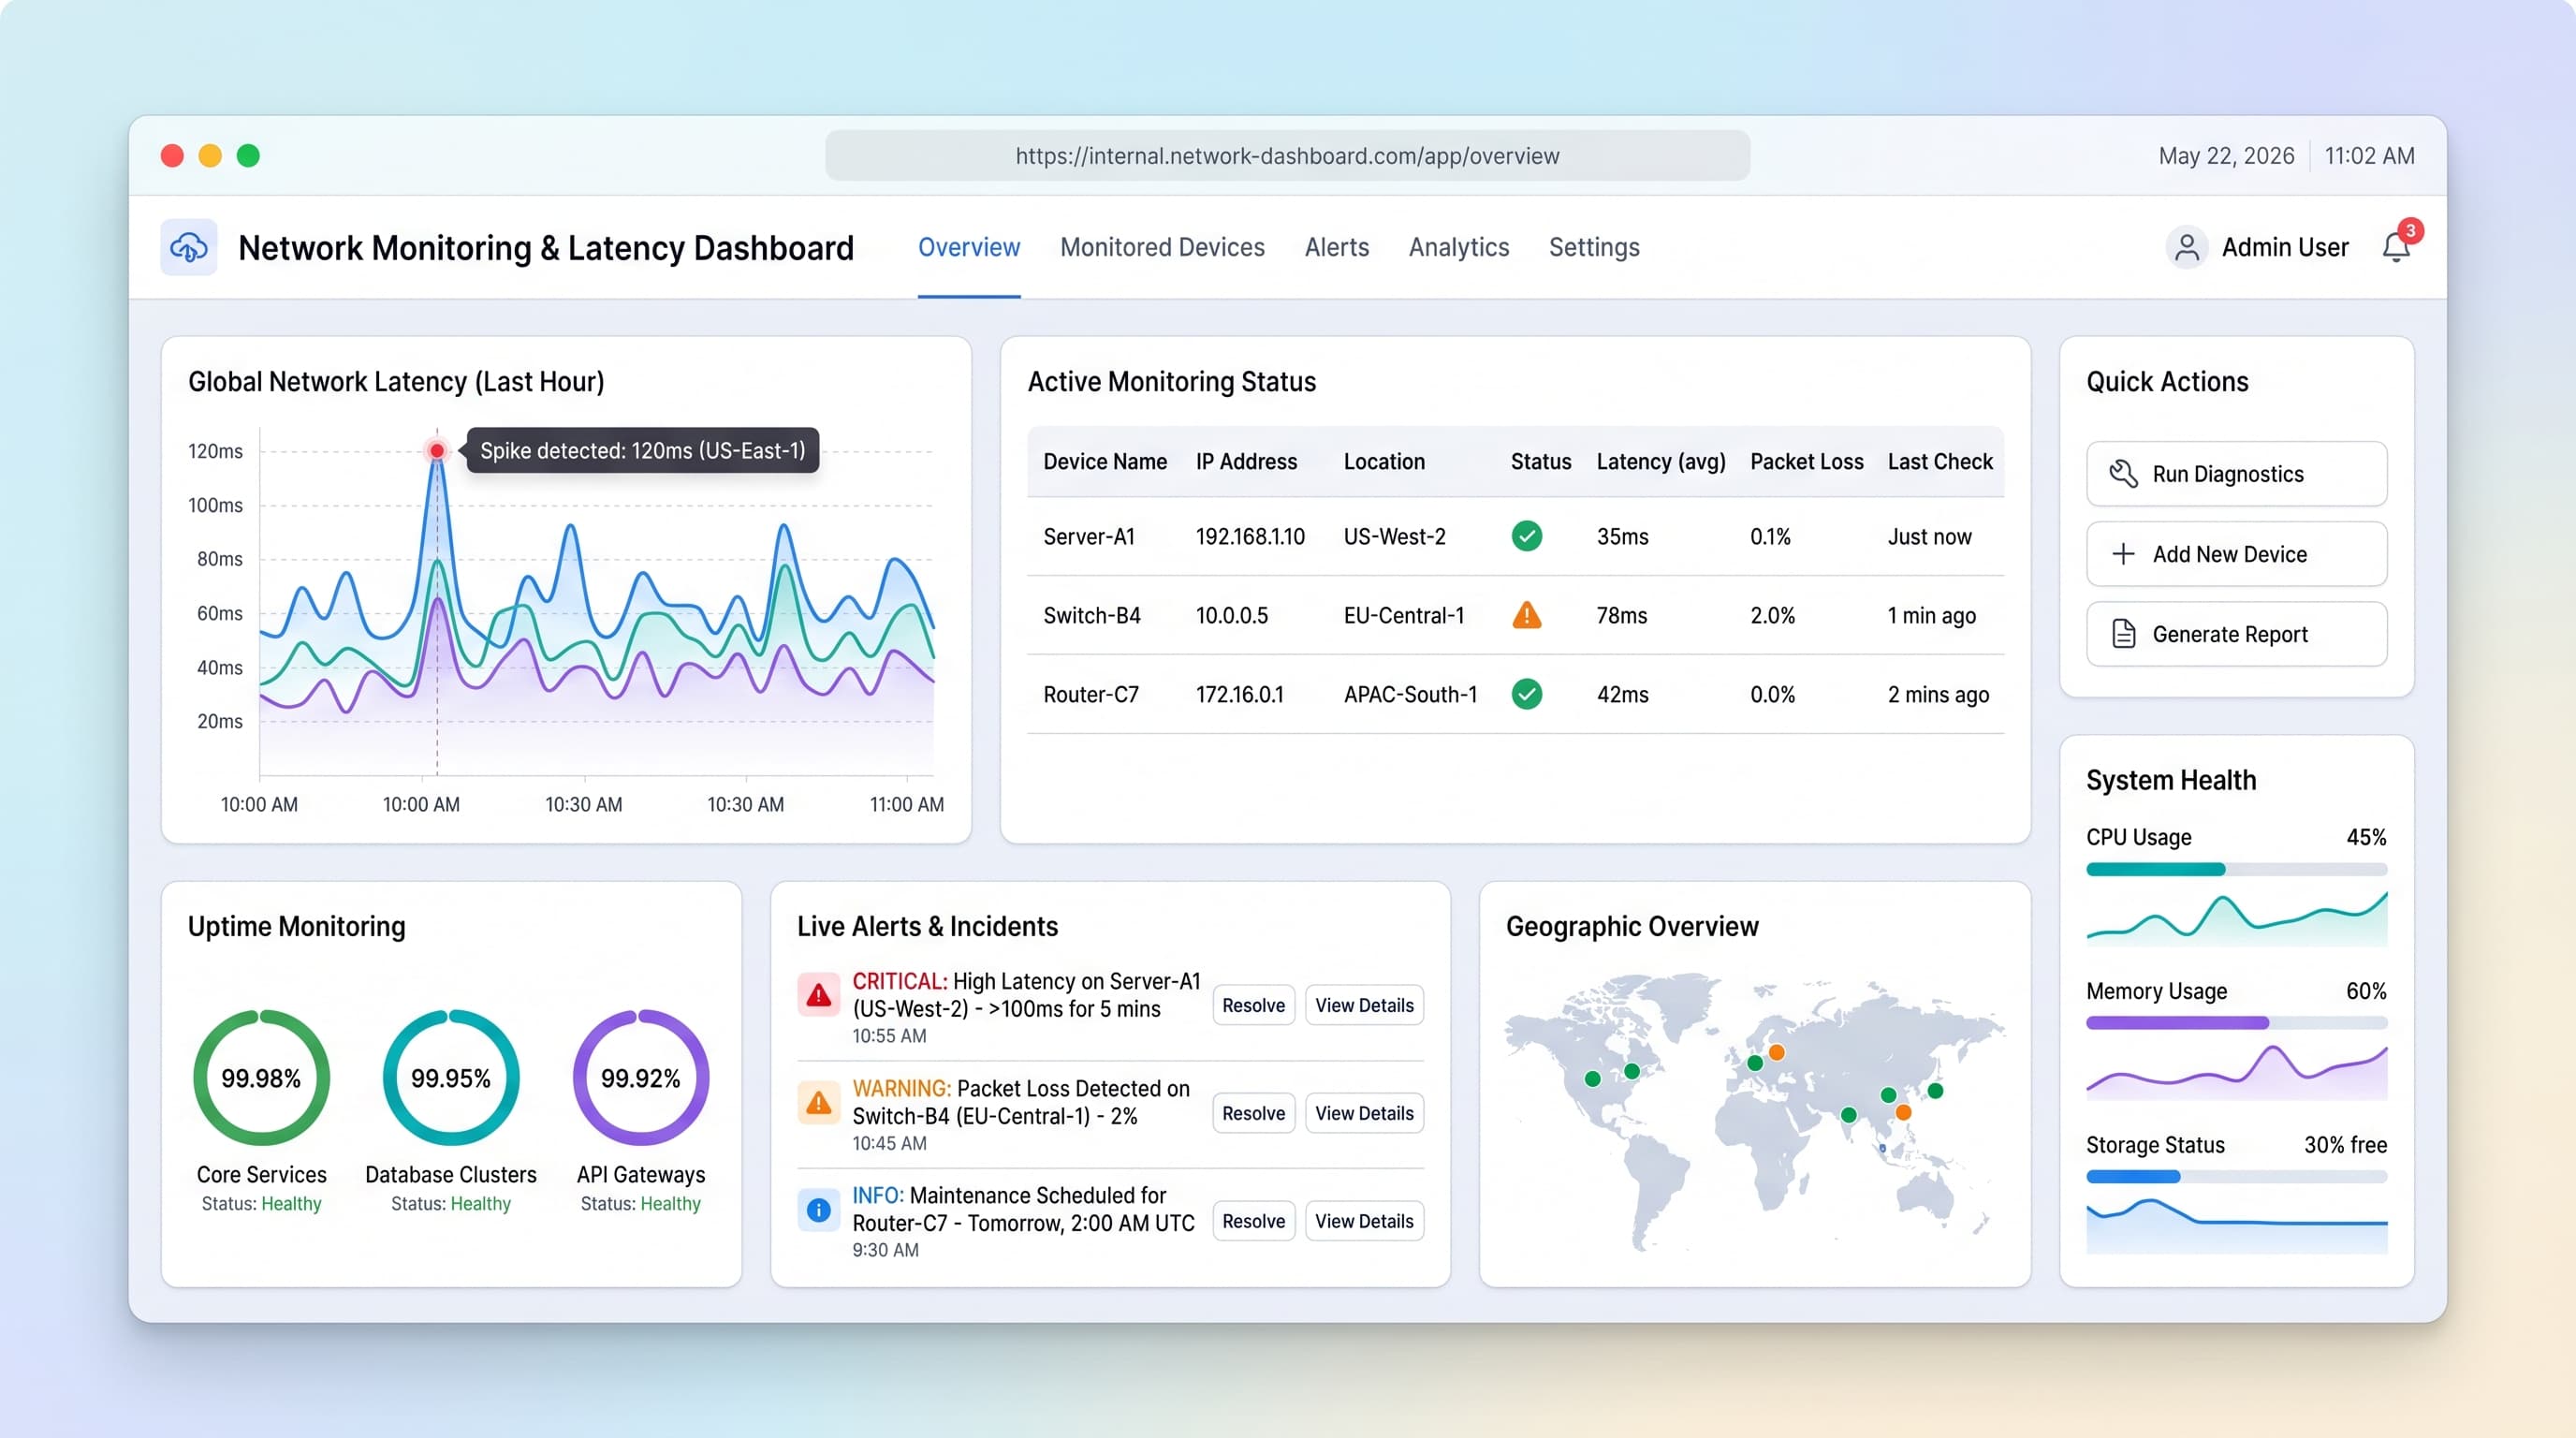
Full AI app builder prompt
Build a comprehensive network monitoring dashboard that tracks server uptime, latency, and connectivity health across multiple endpoints. Core Features: - Multi-endpoint ping monitoring: Add unlimited servers/services to track (IP addresses, domains, APIs) - Real-time latency graphs: Line charts showing ping response times over 1h/24h/7d/30d periods - Uptime percentage calculator: Track availability with 99.9% SLA metrics - Alert system: Email/webhook notifications when endpoints go down or latency exceeds thresholds - Historical data export: Download CSV reports of all ping tests and incidents - Status page: Public-facing page showing current status of all monitored services Data Model: - Endpoints table: name, target (URL/IP), type (server/API/website), expected_response_time, check_interval - Ping_logs table: endpoint_id, timestamp, response_time_ms, status (success/timeout/error), error_message - Alert_rules table: endpoint_id, condition (downtime/latency_threshold), notification_method, recipients - Incidents table: endpoint_id, start_time, end_time, duration, impact_level, notes Pages: 1. Dashboard: Grid of all endpoints with current status (green/yellow/red), average response time, uptime percentage 2. Endpoint detail: Individual graphs, recent ping history table, edit monitoring settings 3. Alerts configuration: Set up notification rules, test alerts, view alert history 4. Reports: Generate uptime reports, compare endpoint performance, identify trends 5. Public status page: Clean, branded page showing system health for customers UI Style: Clean, technical dashboard with dark mode option. Use color-coded status indicators (green = healthy, yellow = degraded, red = down). Display millisecond precision for latency. Include sparkline mini-charts in endpoint cards. Technical Requirements: - Run ping checks every 1-5 minutes (configurable per endpoint) - Store last 90 days of ping data - Calculate moving averages for smoother trend visualization - Support both ICMP ping and HTTP/HTTPS availability checks - Implement exponential backoff for failed checks to avoid false positives Success Criteria: IT admin can monitor 50+ endpoints, receive instant alerts when services degrade, and generate monthly uptime reports in under 3 clicks.
Best platform fit
This prompt is designed for AI app builders such as Lovable, Base44, Bolt, v0, Replit, and Cursor. Start with the complete prompt, then iterate with your target platform based on the database, auth, deployment, and design controls you need.